Statement I is false — tropical areas have much higher species diversity than temperate areas (the classic latitudinal diversity gradient).
Statement II is also false — temperate regions are more seasonal and less constant, whereas tropical regions are more stable year-round, which promotes niche specialization and higher diversity.
UNIT-2 GENETICS AND EVOLUTION
CH5 – Molecular basis of Inheritance
2 Quizzes
CH6 – Evolution
2 Quizzes
UNIT-3 BIOLOGY IN HUMAN WELFARE
CH8 – Microbes in Human Welfare
2 Quizzes
UNIT-4 BIOTECHNOLOGY
Unit-5 ECOLOGY
CH11 – Organisms and Populations
2 Quizzes
CH12 – Ecosystem
2 Quizzes
CH13 – Biodiversity and Conservation
2 Quizzes
Biodiversity and Conservation NCERT
Time limit: 0
Quiz Summary
0 of 50 Questions completed
Questions:
Information
You have already completed the quiz before. Hence you can not start it again.
Quiz is loading…
You must sign in or sign up to start the quiz.
You must first complete the following:
Results
Quiz complete. Results are being recorded.
Results
0 of 50 Questions answered correctly
Your time:
Time has elapsed
You have reached 0 of 0 point(s), (0)
Earned Point(s): 0 of 0, (0)
0 Essay(s) Pending (Possible Point(s): 0)
Categories
- Not categorized 0%
- 1
- 2
- 3
- 4
- 5
- 6
- 7
- 8
- 9
- 10
- 11
- 12
- 13
- 14
- 15
- 16
- 17
- 18
- 19
- 20
- 21
- 22
- 23
- 24
- 25
- 26
- 27
- 28
- 29
- 30
- 31
- 32
- 33
- 34
- 35
- 36
- 37
- 38
- 39
- 40
- 41
- 42
- 43
- 44
- 45
- 46
- 47
- 48
- 49
- 50
- Current
- Review
- Answered
- Correct
- Incorrect
- Question 1 of 50
1. Question
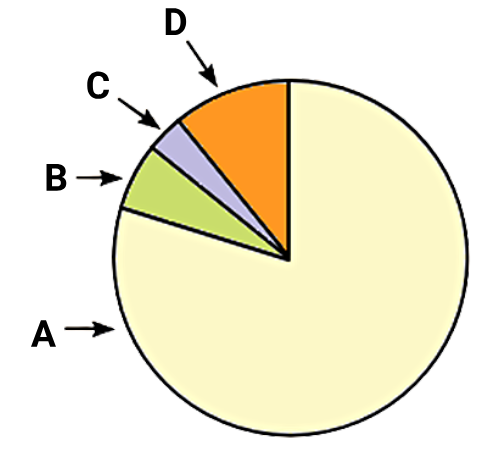
1 point(s)The following pie chart proportionate the number of species in various invertebrate taxa. A, B and C will represent :

The following pie chart proportionate the number of species in various invertebrate taxa. A, B and C will represent:
\(
\begin{array}{|l|l|l|l|}
\hline
& A & B & C \\
\hline
1. & \text{Insects} & \text{Echinoderms} & \text{Molluscs} \\
\hline
2. & \text{Insects} & \text{Molluscs} & \text{Crustaceans} \\
\hline
3. & \text{Crustaceans} & \text{Insects} & \text{Molluscs} \\
\hline
4. & \text{Molluscs} & \text{Crustaceans} & \text{Insects} \\
\hline
\end{array}
\)CorrectIncorrectHint
(b)
- Question 2 of 50
2. Question
1 point(s)Match each item in Column I with one in Column II and choose the correct answer from the codes given below :
\(
\begin{array}{|l|l|l|l|}
\hline & \begin{array}{l}
\text { COLUMN } \\
\text { I }
\end{array} & & \text { COLUMN II } \\
\hline \text { A } & \begin{array}{l}
\text { Genetic } \\
\text { diversity }
\end{array} & \text { a. } & \begin{array}{l}
\text { Western ghats have greater amphibian } \\
\text { diversity than eastern ghats }
\end{array} \\
\hline \text { B. } & \begin{array}{l}
\text { Species } \\
\text { diversity }
\end{array} & \text { b. } & \begin{array}{l}
\text { India has more than } 50000 \text { genetically } \\
\text { different strains of rice }
\end{array} \\
\hline \text { C. } & \begin{array}{l}
\text { Ecological } \\
\text { diversity }
\end{array} & \text { c. } & \begin{array}{l}
\text { India has more ecosystems than } \\
\text { Norway }
\end{array} \\
\hline
\end{array}
\)
Codes:
\(
\begin{array}{|l|l|l|l|}
\hline & \text { A } & \text { B } & \text { C } \\
\hline 1 . & \text { a } & \text { b } & \text { c } \\
\hline 2 . & \text { b } & \text { a } & \text { c } \\
\hline 3 . & \text { c } & \text { b } & \text { a } \\
\hline 4 . & \text { b } & \text { c } & \text { a } \\
\hline
\end{array}
\)CorrectIncorrectHint
(b)
- Question 3 of 50
3. Question
1 point(s)Identify the incorrect statement :
\(
\begin{array}{|l|l|}
\hline \text { 1. } & \begin{array}{l}
\text { Biodiversity is the term popularised by the } \\
\text { sociobiologist Edward Wilson to describe the } \\
\text { combined diversity at all levels of biological } \\
\text { organisation. }
\end{array} \\
\hline \text { 2. } & \begin{array}{l}
\text { IUCN stands for International Union for Conservation } \\
\text { of Nature and Natural resources. }
\end{array} \\
\hline \text { 3. } & \begin{array}{l}
\text { Robert May places the global species diversity in the } \\
\text { range of } 20 \text { to } 50 \text { million. }
\end{array} \\
\hline \text { 4. } & \begin{array}{l}
\text { More than } 25 \text { percent of the drugs currently sold in } \\
\text { the market are derived from the plants. }
\end{array} \\
\hline
\end{array}
\)CorrectIncorrectHint
(c)
- Question 4 of 50
4. Question
1 point(s)Given below are two statements : one is labelled as Assertion (A) and the other is labelled as Reason (R).
Assertion (A): Biologists make a statistical comparison of the temperate-tropical species richness of an exhaustively studied group of insects and extrapolate this richness to other group of animals and plants and come up with a gross estimate of the total number of species on earth.
Reason (R): Insects are the most successful living organisms among animals and plants.
In the light of the above statements, choose the most appropriate answer from the options given below :CorrectIncorrectHint
(a)
Why (R) doesn’t explain (A): The reason for using insects as a basis for extrapolation is not that they are the “most successful,” but that they are extremely species-rich and comparatively well sampled, giving robust temperate–tropical ratios. Thus, (R) is not the causal basis of the method described in (A).
- Question 5 of 50
5. Question
1 point(s)Approximately, what number of species have been identified, named and studied ?
CorrectIncorrectHint
(a)
- Question 6 of 50
6. Question
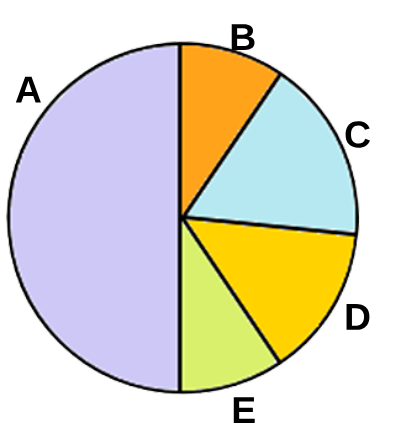
1 point(s)The following pie chart proportionate the number of species in various vertebrate taxa. What will be true regarding the animals shown in the pie chart ?

\(
\begin{array}{|l|l|}
\hline \text { Statement I: } & \text { ‘A’ group will be of fishes. } \\
\hline \text { Statement II: } & \text { ‘B’ and ‘C’ are endotherms. } \\
\hline \text { Statement III: } & \text { ‘D’ are more successful on land than ‘E’. } \\
\hline
\end{array}
\)CorrectIncorrectHint
(d)
- Question 7 of 50
7. Question
1 point(s)Amongst the vertebrates, the Class with maximum number of species is :
CorrectIncorrectHint
(a)
- Question 8 of 50
8. Question
1 point(s)Although, India has only \( 2.4 \% \) of world’s area, its share of global species diversity is about:
CorrectIncorrectHint
(c)
- Question 9 of 50
9. Question
1 point(s)What is the number of mega-diversity countries in the world ?
CorrectIncorrectHint
(b)
- Question 10 of 50
10. Question
1 point(s)Given below are two statements : one is labelled as Assertion (A) and the other is labelled as Reason (R).
\(
\begin{array}{|l|l|}
\hline \text { Assertion (A): } & \begin{array}{l}
\text { Biologists are not sure about how many } \\
\text { prokaryotic species there might be. }
\end{array} \\
\hline \text { Reason (R): } & \begin{array}{l}
\text { A large number of species have not been } \\
\text { data based so far. }
\end{array} \\
\hline
\end{array}
\)
In the light of the above statements, choose the most appropriate answer from the options given below :CorrectIncorrectHint
(b)
- Question 11 of 50
11. Question
1 point(s)Given below are two statements : one is labelled as Assertion (A) and the other is labelled as Reason (R).
\(
\begin{array}{|l|l|}
\hline \text { Assertion (A): } & \begin{array}{l}
\text { There is a steady increase in species } \\
\text { richness from the arctic to the tropics. }
\end{array} \\
\hline \text { Reason (R): } & \begin{array}{l}
\text { Seasonal variation is substantially more } \\
\text { in tropics than in arctics. }
\end{array} \\
\hline
\end{array}
\)
In the light of the above statements, choose the most appropriate answer from the options given below :CorrectIncorrectHint
(c)
Reason (R) – False: Seasonality is lower in the tropics and higher in the arctic/temperate zones. The tropics have relatively stable temperatures and daylength year-round; high latitudes show pronounced seasonal swings.
Hence, (R) contradicts reality and cannot explain (A).
- Question 12 of 50
12. Question
1 point(s)Regarding the gradients of biodiversity :
\(
\begin{array}{|l|l|}
\hline \text { I: } & \begin{array}{l}
\text { As we move from poles to the equator, broadly } \\
\text { speaking, biodiversity decreases. }
\end{array} \\
\hline \text { II: } & \begin{array}{l}
\text { There is an increase in species diversity from lower } \\
\text { to higher altitudes. }
\end{array} \\
\hline
\end{array}
\)CorrectIncorrectHint
(d)
is wrong because global patterns show species richness generally increases from the poles to the equator (the latitudinal diversity gradient), not decreases.
II is wrong because species diversity normally falls with increasing altitude (less area, harsher climate, lower productivity). There are exceptions (e.g., some groups show a mid-elevation peak), but the general trend is a decline with altitude
- Question 13 of 50
13. Question
1 point(s)The greatest biodiversity on the earth is found in :
CorrectIncorrectHint
(b)
- Question 14 of 50
14. Question
1 point(s)Which of the following is not a reason that accounts for greater biodiversity of tropics ?
CorrectIncorrectHint
(d)
- Question 15 of 50
15. Question
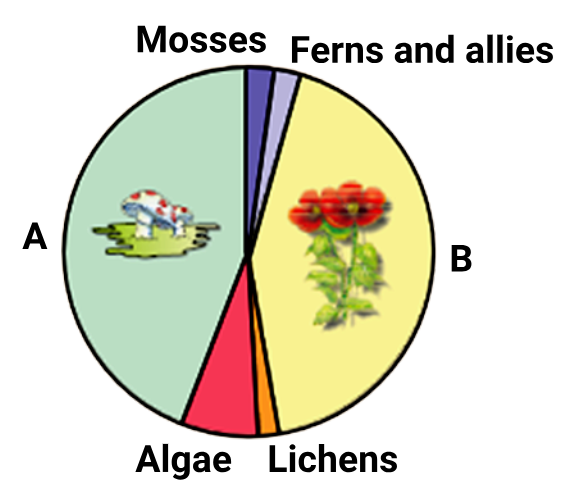
1 point(s)The following pie chart proportionate the number of species in various plant taxa. What will be true regarding the organisms shown in the pie chart ?

Statement I: All members of A are heterotrophs.
Statement II: The primary reason for the success of B on land is the presence of the reproductive organ, flower.CorrectIncorrectHint
(c)
- Question 16 of 50
16. Question
1 point(s)Given below are two statements : one is labelled as Assertion (A) and the other is labelled as Reason (R).
\(
\begin{array}{|l|l|}
\hline \text { Assertion (A): } & \begin{array}{l}
\text { Species diversity contributes to the well- } \\
\text { being of an ecosystem. }
\end{array} \\
\hline \text { Reason (R): } & \begin{array}{l}
\text { Rich biodiversity contributes to higher } \\
\text { productivity of an ecosystem. }
\end{array} \\
\hline
\end{array}
\)
In the light of the above statements, choose the most appropriate answer from the options given below :CorrectIncorrectHint
(b)
But higher productivity alone does not explain ecosystem well-being (which also depends on stability, resistance to invasion, nutrient cycling, etc.).
👉 Hence, R does not explain A. ✅
- Question 17 of 50
17. Question
1 point(s)The rivet popper hypothesis was given by:
CorrectIncorrectHint
(b)
- Question 18 of 50
18. Question
1 point(s)The now extinct thylacine was a native of :
CorrectIncorrectHint
(c)
- Question 19 of 50
19. Question
1 point(s)Consider the two statements :
\(
\begin{array}{|l|l|}
\hline \text { I: } & \begin{array}{l}
\text { Species diversity seen in tropical areas is much lower } \\
\text { than that seen in temperate areas. }
\end{array} \\
\hline \text { II: } & \begin{array}{l}
\text { Temperate areas, unlike tropical areas are less } \\
\text { seasonal, more constant and promote niche } \\
\text { specialization. }
\end{array} \\
\hline
\end{array}
\)CorrectIncorrectHint
(d)
- Question 20 of 50
20. Question
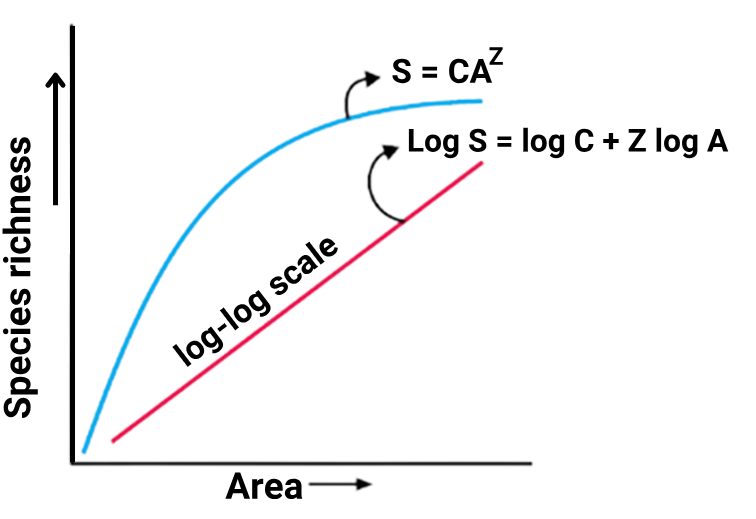
1 point(s)How many of the given statements will be true regarding the graph showing species – area relationship ?

I. Within a region, species richness decreases with increasing explored area.
II. The rectangular hyperbola represents the relation between species richness and area for angiosperm plants, birds, bats and freshwater fishes, for example.
III. Z represents the regression coefficient or the slope of the line.
IV. The value of Z lies in the range of 0.1 to 0.2 regardless of the taxonomic group or the region.
V. For frugivorous birds and mammals in the tropical forests of different continents, the slope is found to be 1.15 .
VI. If the species area relationship is analysed for very large areas, the slope of the line is much steeper and Z value lies in the range of 0.6 to 1.2 .CorrectIncorrectHint
(c)
Statement I: Within a region, species richness decreases with increasing explored area.
❌ False. The graph clearly shows species richness increases with area.
- Question 21 of 50
21. Question
1 point(s)The name of Alexander von Humboldt is associated with the concept of:
CorrectIncorrectHint
(d)
- Question 22 of 50
22. Question
1 point(s)On a logarithmic scale, the species-area relationship turns out to be a:
CorrectIncorrectHint
(a)
- Question 23 of 50
23. Question
1 point(s)All the following describe a stable biological community except :
CorrectIncorrectHint
(a)
- Question 24 of 50
24. Question
1 point(s)Identify the incorrectly matched pair :
\(
\begin{array}{|l|l|l|}
\hline \text { 1. } & \text { Dodo } & \text { Mauritius } \\
\hline \text { 2. } & \text { Quagga } & \text { Africa } \\
\hline \text { 3. } & \text { Thylacine } & \text { Australia } \\
\hline \text { 4. } & \text { Stellar’s sea cow } & \text { USA } \\
\hline
\end{array}
\)CorrectIncorrectHint
(d)
- Question 25 of 50
25. Question
1 point(s)Which of the following species of tiger has not gone extinct ?
CorrectIncorrectHint
(d)
- Question 26 of 50
26. Question
1 point(s)Which group, amongst the following, has the maximum percentage of species facing threat of extinction ?
CorrectIncorrectHint
(a)
- Question 27 of 50
27. Question
1 point(s)Given below are two statements : one is labelled as Assertion (A) and the other is labelled as Reason (R).
\(
\begin{array}{|l|l|}
\hline \text { Assertion (A): } & \begin{array}{l}
\text { The current mass extinction is different } \\
\text { from the previous episodes of mass } \\
\text { extinctions. }
\end{array} \\
\hline \text { Reason (R): } & \begin{array}{l}
\text { It is happening at a faster rate and is } \\
\text { mainly anthropogenic in nature. }
\end{array} \\
\hline
\end{array}
\)
In the light of the above statements, choose the most appropriate answer from the options given below :CorrectIncorrectHint
(a)
- Question 28 of 50
28. Question
1 point(s)Loss of biodiversity may lead to all except :
CorrectIncorrectHint
(b)
- Question 29 of 50
29. Question
1 point(s)At present, the most important cause driving animals and plants to extinction is :
CorrectIncorrectHint
(d)
- Question 30 of 50
30. Question
1 point(s)Consider the given two statements :
\(
\begin{array}{|l|l|}
\hline \text { I: } & \begin{array}{l}
\text { Fragmentation of habitat is an important cause of } \\
\text { extinction of species. }
\end{array} \\
\hline \text { II: } & \begin{array}{l}
\text { Minor fluctuations in climate, resources or other } \\
\text { factors can be catastrophic in small, isolated } \\
\text { populations. }
\end{array} \\
\hline
\end{array}
\)CorrectIncorrectHint
(a)
- Question 31 of 50
31. Question
1 point(s)Extinction of Steller’s sea cow and passenger pigeon was due to :
CorrectIncorrectHint
(b)
- Question 32 of 50
32. Question
1 point(s)Lantana camara and Clarias gariepinus are examples of :
CorrectIncorrectHint
(a)
- Question 33 of 50
33. Question
1 point(s)Given below are two statements : one is labelled as Assertion (A) and the other is labelled as Reason (R).
\(
\begin{array}{|l|l|}
\hline \text { Assertion (A): } & \begin{array}{l}
\text { Non-native introduced species always } \\
\text { have a negative impact on the ecosystem } \\
\text { in which they have been introduced. }
\end{array} \\
\hline \text { Reason (R): } & \begin{array}{l}
\text { Non-native species always become } \\
\text { invasive in the introduced ecosystem. }
\end{array} \\
\hline
\end{array}
\)
In the light of the above statements, choose the most appropriate answer from the options given below :CorrectIncorrectHint
(d)
Why (A) is false: Non-native (introduced) species do not always have a negative impact. Some introductions are neutral or beneficial — for example, many crop plants and domesticates (wheat, rice, etc.) and useful introductions (e.g., honeybee Apis mellifera for pollination, or the vedalia beetle Rodolia cardinalis introduced to control cottony cushion scale in citrus) have provided clear benefits. So a blanket statement that they always harm the ecosystem is incorrect.
Why (R) is false: Not all non-native species become invasive. Invasive species are a subset of introduced species that become established, spread rapidly, and cause ecological or economic harm. Many introduced species fail to establish or persist, or remain present without spreading or causing damage.
- Question 34 of 50
34. Question
1 point(s)Identify the correctly matched pairs :
\(
\begin{array}{|l|l|l|}
\hline
\text{I} & \text{Narrowly utilitarian argument for conserving biodiversity} &
\begin{array}{l}
\text{Humans derive countless} \\
\text{direct benefits from nature.}
\end{array} \\
\hline
\text{II} & \text{Broadly utilitarian argument for conserving biodiversity} &
\begin{array}{l}
\text{Biodiversity plays a major role in} \\
\text{many ecosystem services that} \\
\text{nature provides.}
\end{array} \\
\hline
\text{III} & \text{Ethical argument for conserving biodiversity} &
\begin{array}{l}
\text{We owe to millions of plant, animal} \\
\text{and microbe species with whom} \\
\text{we share this planet.}
\end{array} \\
\hline
\end{array}
\)CorrectIncorrectHint
(c)
- Question 35 of 50
35. Question
1 point(s)The search for previously unknown compounds in organisms that have never been used in traditional medicine is known as :
CorrectIncorrectHint
(b)
- Question 36 of 50
36. Question
1 point(s)Biodiversity should be conserved as it plays a major role in many ecosystem services that nature provides. Such an argument is called :
CorrectIncorrect - Question 37 of 50
37. Question
1 point(s)What percentage of total oxygen in the earth’s atmosphere is produced by Amazon rainforest through photosynthesis ?
CorrectIncorrectHint
(d)
- Question 38 of 50
38. Question
1 point(s)Identify the correct fact regarding the biodiversity hot spots in the world :
CorrectIncorrectHint
(c)
- Question 39 of 50
39. Question
1 point(s)Consider the following statements regarding hotspots of biodiversity :
\(
\begin{array}{|l|l|}
\hline \text { I. } & \begin{array}{l}
\text { They are characterized by high endemism and high } \\
\text { threat of extinction. }
\end{array} \\
\hline \text { II. } & \text { Three of the } 34 \text { hotspots in the world cover India. } \\
\hline \text { III. } & \begin{array}{l}
\text { All biodiversity hotspots cover about } 10 \% \text { of the } \\
\text { world area. }
\end{array} \\
\hline
\end{array}
\)CorrectIncorrectHint
(a)
III — False. All hotspots do not cover ~10% of the world; the recognised hotspots together cover only a small fraction of the land surface (around 2–2.5% of Earth’s land area) while containing a very large share of endemic species
- Question 40 of 50
40. Question
1 point(s)The biodiversity hotspots in India include all the following except :
CorrectIncorrectHint
(d)
- Question 41 of 50
41. Question
1 point(s)Sacred groves, found in Khasi and Jaintia Hills, are located in the Indian state of:
CorrectIncorrectHint
(c)
- Question 42 of 50
42. Question
1 point(s)When a threatened plant needs urgent measures to save it from extinction, the desirable approach is :
CorrectIncorrectHint
(b)
- Question 43 of 50
43. Question
1 point(s)Given below are two statements : one is labelled as Assertion (A) and the other is labelled as Reason (R).
\(
\begin{array}{|l|l|}
\hline \text { Assertion (A): } & \begin{array}{l}
\text { Conserving the biological diversity of } \\
\text { the ecological hotspots is very important } \\
\text { component of efforts to safeguard the } \\
\text { world’s biological heritage. }
\end{array} \\
\hline \text { Reason (R): } & \begin{array}{l}
\text { The hotspots of biodiversity cover a } \\
\text { large percentage of the land area of earth. }
\end{array} \\
\hline
\end{array}
\)
In the light of the above statements, choose the most appropriate answer from the options given below :CorrectIncorrectHint
(c)
Reason (R) — False. Hotspots do not cover a large percentage of Earth’s land; they occupy only a small fraction of the land surface (while containing a very large share of endemic species). Therefore R is not a correct explanation of A
- Question 44 of 50
44. Question
1 point(s)What percent of earth’s area is covered by hotspots of biodiversity ?
CorrectIncorrectHint
(a)
- Question 45 of 50
45. Question
1 point(s)According to your NCERT text, the number of biosphere reserves, national parks and wildlife sanctuary in India are respectively:
CorrectIncorrectHint
(a)
- Question 46 of 50
46. Question
1 point(s)Which of the following is not an ex-situ method for conservation of biodiversity ?
CorrectIncorrectHint
(c)
- Question 47 of 50
47. Question
1 point(s)The historic convention on Biological Diversity held in Rio de Janeiro in 1992 is known as :
CorrectIncorrectHint
(b)
- Question 48 of 50
48. Question
1 point(s)The World Summit on Sustainable Development was held in :
CorrectIncorrectHint
(c)
- Question 49 of 50
49. Question
1 point(s)Earth Summit 2012 was held in :
CorrectIncorrectHint
(a)
- Question 50 of 50
50. Question
1 point(s)Which one of the following is not a major characteristic feature of biodiversity hotspots ?
CorrectIncorrectHint
(d)