What is a nonlinear function
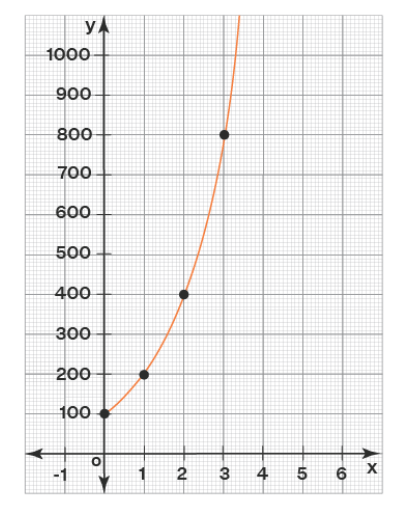
A nonlinear function is a function whose graph is not a straight line. Its graph can be any curve other than a straight line. For example, if there are 100 fishes in a pond initially and they become double every week, then this situation can be modeled by the function \(y=100(2)^x\), where \(x\) is the number of weeks and \(y\) is the number of fishes. Let us make a table and graph this function making use of the table.
\(\begin{array}{|l|l|}
\hline \mathbf{x} & \mathbf{y} \\
\hline 0 & 100 \\
\hline 1 & 200 \\
\hline 2 & 400 \\
\hline 3 & 800 \\
\hline
\end{array}
\)
Let’s graph the table now.

The above graph is not a straight line and hence it represents a nonlinear function. From the above graph, we can say that the slope is not uniform on a nonlinear function.