Nonlinear function table
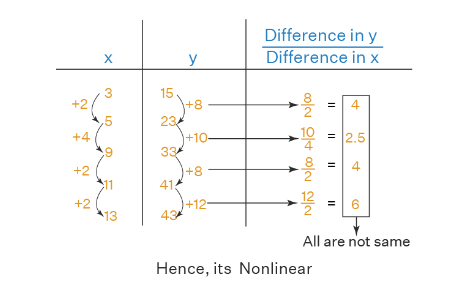
Follow the following steps to identify if the function is nonlinear.
- Find the differences between every two consecutive x values.
- Find the differences between every two consecutive y values.
- Find the corresponding ratios of differences of y and differences of x.
- If all the ratios are not the same, then only the function is nonlinear.
Consider the following table of values.
\(\begin{array}{|l|l|}
\hline \mathbf{x} & \mathbf{y} \\
\hline 3 & 15 \\
\hline 5 & 23 \\
\hline 9 & 33 \\
\hline 11 & 41 \\
\hline 13 & 43 \\
\hline
\end{array}
\)
Let us determine whether this table denotes a nonlinear function by using the steps mentioned above.

Since all the ratios of differences of y to the differences of x are not the same, the function is a nonlinear function.
Some examples of nonlinear functions are
\(f(x)=x^2\) is nonlinear as it is a quadratic function.
\(f(x)=2^x\) is nonlinear as it is an exponential function.
\(f(x)=x^3-3 x\) is nonlinear as it is a cubic function.
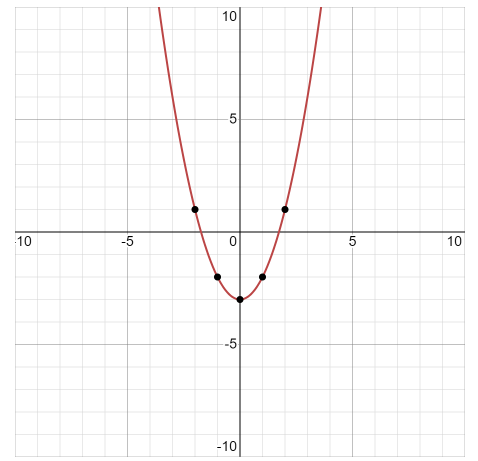
Example 1: \(\text { Graph } f(x)=x^2-3\)
Solution:
The domain is all real numbers. This means we can choose any values for \(\mathrm{x}\).
The range is \([-3, \infty)\). The smallest value we can obtain for \(y\) is \(-3\). This is when \(x=0\). When \(x=0\), the graph will have a point at the lowest point of our graph. We will choose \(x=0\). Then choose two numbers to the left of 0 and two numbers to the right of 0.
\begin{array}{r|r}
\mathrm{x} & \mathrm{y} \\
\hline-2 & 1 \\
-1 & -2 \\
0 & -3 \\
1 & -2 \\
2 & 1
\end{array}
\)
