Probability Using Venn Diagram
In probability, a Venn diagram is a figure with one or more circles inside a rectangle that describes logical relations between events. The rectangle in a Venn diagram represents the sample space or the universal set, that is, the set of all possible outcomes. A circle inside the rectangle represents an event, that is, a subset of the sample space. We consider the following Venn diagram involving two events, 𝐴 and 𝐵.

In the diagram above, we have two events \(A\) and \(B\) within the sample space (or universal set) \(S\). Colored regions in this Venn diagram represent the following events:
Green and purple regions : \(A\),
Blue and purple regions : \(B\),
Purple region : \(A \cap B\),
Green, purple, and blue regions : \(A \cup B\),
Yellow region : \(\overline{A \cup B}\), alternatively, \((A \cup B)^{\prime}\).
How to calculate probabilities from a Venn diagram
In order to calculate probabilities from a Venn diagram:
- Determine the parts of the Venn diagram that are in the subset.
- Calculate the frequency of the subset.
- Calculate the total frequency of the larger set.
- Write the probability as a fraction, and simplify.
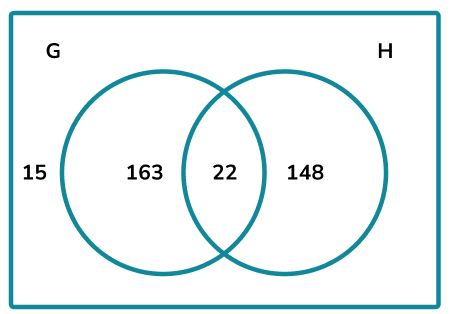
Example 1: The universal set = Students in Year 10\(\}\). The Venn diagram shows the frequencies of students that belong to the two sets depending on which GCSE they study: \(G=\{\) Geography \(\}\), and \(H=\{\) History \(\}\). Calculate \(P\left((G \cap H)^{\prime}\right)\).
Solution:
Step 1: Determine the parts of the Venn diagram that are in the subset.
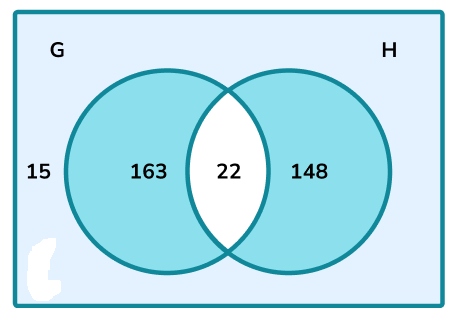
The complement to the intersection of \(G\) and \(H\) is the region:
Step 2: Calculate the frequency of the subset.
The frequency of numbers within this subset is
Step 3: The larger set is the universal set. The total frequency is therefore:
Step 4: Write the probability as a fraction, and simplify.
\(\begin{aligned}
& \frac{326}{348}=\frac{163}{174} \\
& P\left((G \cap H)^{\prime}\right)=\frac{163}{174} .
\end{aligned}
\)
Example 2: people in a community group were asked about which of the three hobbies they enjoy. The three hobbies were Sewing, Pottery, and Painting. The results are displayed in a three-circle Venn diagram below.
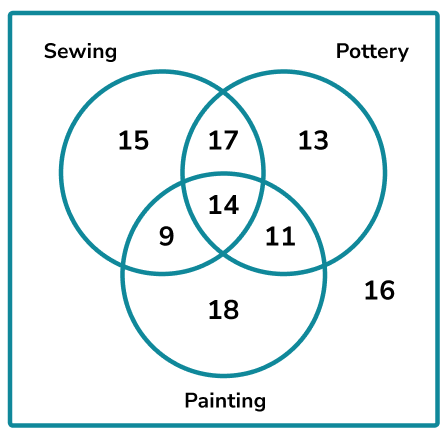
What is the probability of picking a person at random that enjoys two or more hobbies?
Solution:
Determine the parts of the Venn diagram that are in the subset: As we are being asked about the frequency of two or more hobbies, we need to look at all of the values within the intersections of each circle.
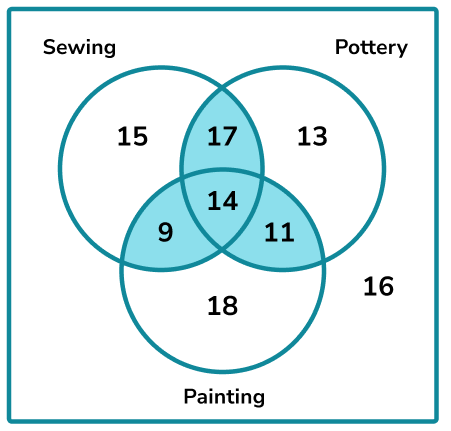
Calculate the frequency of the subset: 17+14+9+11=51
Calculate the total frequency of the larger set: 15+17+13+9+14+11+18+16=113
Write the probability as a fraction, and simplify: \(P \text { (two or more hobbies) }=\frac{51}{113}\)
Definition: Two-Event Venn Diagrams
Let \(A\) and \(B\) be events described in a Venn diagram. Then,
- the circles do not overlap if \(A\) and \(B\) are mutually exclusive events, that is, \(A \cap B=\varnothing\);
- the circles overlap if \(A \cap B \neq \varnothing\), in which case the intersection \(A \cap B\) is represented by the overlapping region;
- the region outside both circles but within the rectangle represents the complement of the union of both events, that is, \(\overline{A \cup B}\) or, alternatively, \((A \cup B)^{\prime}\).
Within each divided region of a Venn diagram, we can add data in one of the following ways:
- the outcomes of the event,
- the number of outcomes in the event,
- the probability of the event.
Example 3: A class contains 100 students; 70 of them like mathematics, 60 like physics, and 40 like both. If a student is chosen at random, using a Venn diagram, find the probability that they like mathematics but not physics.
Solution:
We know that the overlapping region in a Venn diagram represents the intersection of the events. We are given that 40 students belong to this intersection since they like both mathematics and physics. 70 students like mathematics, and 40 of them also like physics. This tells us that the number of students who like mathematics only is 70−40=30. Similarly, we can deduce that 60−40=20 students like physics only. This leads to the following Venn diagram.
We note that the number 10 outside is to ensure that the sum of all values within the Venn diagram is equal to 100, since the class contains 100 students total. We are looking for the probability that a randomly chosen student likes mathematics but not physics. The region of the Venn diagram representing this event is highlighted below.
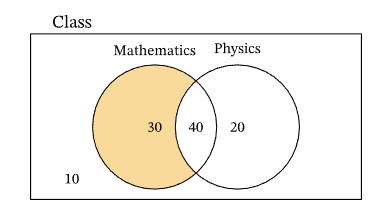
From the Venn diagram, we note that 30 students like mathematics but not physics. Since a student is randomly selected, we can obtain the probability of this event when dividing this number by the total number of students, which is 100. Hence, the probability that a randomly selected student likes mathematics but not physics is \(\frac{30}{100}=0.3\).
Example 4: Yara has drawn this Venn diagram to record the result of randomly selecting a number between 1 and 12.
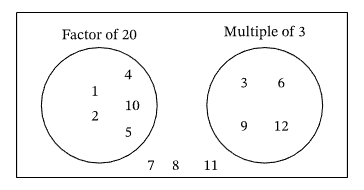
- What is the probability of selecting a number that is a factor of 20? Give your answer as a fraction in its simplest form.
- What is the probability of selecting a number that is a factor of 20 and a multiple of 3? Give your answer as a fraction in its simplest form.
- What is the probability of selecting a number that is not a multiple of 3? Give your answer as a fraction in its simplest form.
Solution:
In the given Venn diagram, two events are represented as circles: “Factor of 20 ” and “Multiple of 3.” The sample space of this Venn diagram is the set of integers between 1 and 12 . In other words, the sample space (or the universal set) is given by
\(
S=\{1,2,3, \ldots, 12\} .
\)
(1) Since we are randomly selecting a number between 1 and 12, the probability of an event can be obtained by dividing the size of the event by the size of the sample space, which is 12. In other words,
\(
P(\text { factor of } 20)=\frac{\text { number of factors of } 20}{12} .
\)
We can see from the Venn diagram that there are 5 different factors of 20 between 1 and 12.
Hence, the probability of selecting a number between 1 and 12 that is a factor of 20 is \(\frac{5}{12}\).
(2) We note that the two events are mutually exclusive since the circles in the Venn diagram do not overlap. In other words, there is no number between 1 and 12 which is both a factor of 20 and a multiple of 3. Hence, the probability of this event is equal to 0.
(3) From the Venn diagram, the numbers between 1 and 12 that are not a multiple of 3 lie outside of the circle. We can see that there are 8 numbers that belong to this case.
Hence, the probability that a randomly selected number between 1 and 12 is not a multiple of 3 is \(\frac{8}{12}\), which can be simplified to \(\frac{2}{3}\).
Example 5: In the final exams, \(40 \%\) of the students failed chemistry, \(25 \%\) failed physics, and \(19 \%\) failed both chemistry and physics. What is the probability that a randomly selected student failed physics given that he passed chemistry?
Solution:
We can use the given information to add the relative proportion of each region. Since \(40 \%\) of the students failed chemistry while \(19 \%\) failed both chemistry and physics, we can deduce that \(40 \%-19 \%=21 \%\) of the students only failed chemistry. Similarly, we can obtain that \(25 \%-19 \%=6 \%\) of the students only failed physics. Then, we have the following data:
\(21 \%\) of the students failed chemistry but not physics;
\(6 \%\) of the students failed physics but not chemistry;
\(19 \%\) of the students failed both physics and chemistry.
Now, the remaining relative proportion is for students who passed both subjects. Since the sum of all relative proportions must equal \(100 \%\), the percentage of students who passed both subjects is given by
\(
100 \%-21 \%-6 \%-19 \%=54 \% .
\)
We add these percentages onto the Venn diagram, as follows.
We want to find the probability that a randomly selected student failed physics given that he passed chemistry. The percentage of students who passed chemistry is given outside of the circle labeled “Failed chemistry” in the Venn diagram above. This is the region shaded in purple below. Also, we know that the region shaded in green represents the students who failed physics and passed chemistry.
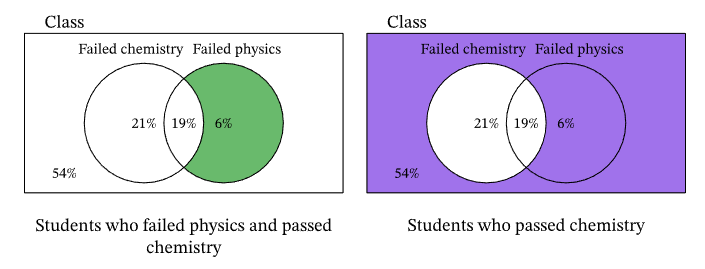
Notice that we are given that the student passed chemistry. This means that we are selecting a student from the group of students who passed chemistry rather than from the entire class. In other words, our sample space (or universal set) is the purple-shaded region above, not the rectangle.
The percentage of students who passed chemistry is given by summing the percentages within the purple region, which leads to \(6 \%+54 \%=60 \%\). Among the students who passed chemistry, the percentage of students who failed physics is found in the green-shaded region, which is \(6 \%\). So, the probability of randomly selecting a student who failed physics from the group of students who passed chemistry is given by
\(\frac{\text { percentage of students who failed physics but passed chemistry }}{\text { percentage of students who passed chemistry }}=\frac{6 \%}{60 \%}=0.1\).
Let us check this answer using the formula for the conditional probability for event \(A\) given event \(B\) :
\(
P(A \mid B)=\frac{P(A \cap B)}{P(B)} .
\)
In our example, this formula can be written as
\(
P \text { (students who failed physics } \mid \text { students who passed chemistry })=
\)
\(
\frac{P \text { (students who failed physics and passed chemistry) }}{P(\text { students who passed chemistry) }} \text {. }
\)
From the green- and purple-shaded regions of the Venn diagram above, we can obtain \(P\) (students who failed physics and passed chemistry \()=0.06\),
\(
P(\text { students who passed chemistry })=0.06+0.54=0.60 .
\)
Substituting these values into the equation above, we obtain
\(
P(\text { students who failed physics } \mid \text { students who passed chemistry })=\frac{0.06}{0.60}=0.1 \text {. }
\)
Hence, the probability that a randomly selected student failed physics given that he passed chemistry is equal to \(0.1\).
Computing Conditional Probabilities Using Venn Diagrams
To compute the conditional probability of event \(A\) given another event \(B\) using a Venn diagram, we need to
- identify the region representing event \(B\) from the Venn diagram and compute the probability of \(B\)
- identify the region representing the intersection \(A \cap B\) and compute the probability of \(A \cap B\)
- compute \(\frac{P(A \cap B)}{P(B)}\).
We note that this process leads to the standard formula
\(
P(A \mid B)=\frac{P(A \cap B)}{P(B)},
\)
where \(P(A \mid B)\) is the conditional probability of event \(A\) given another event \(B\).
We can also use a Venn diagram to describe relationships between three events. In two of the special circumstances listed below, we have a special representation of a three-event Venn diagram.
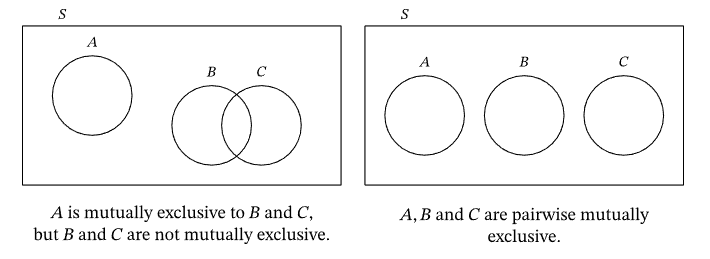
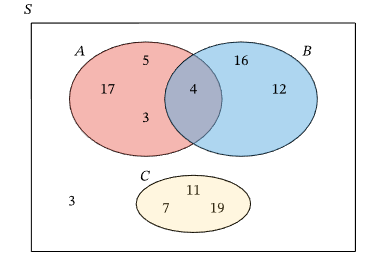
Example 6: Using the Venn Diagram to Determine the Probability of the Union of Two Events. Use the diagram of the sample space \(S\) to determine \(P(B \cup C)\).
Solution:
From the given Venn diagram, we can tell that event \(C\) is mutually exclusive to events \(B\) and \(C\). We recall that the probability of an event can be obtained using a Venn diagram by computing the relative proportion of the event with respect to the sample space.
In the Venn diagram, the sample space is denoted \(S\) and contains 10 different outcomes. Thus, we can compute the probability of our event by dividing the number of outcomes in the event by 10. Event \(B \cup C\) is outlined in purple below.
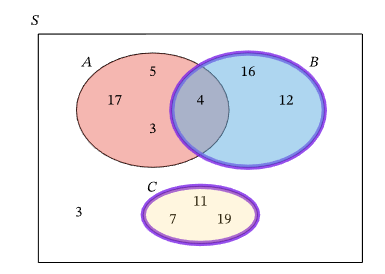
From the diagram above, we note that there are 6 distinct outcomes in the region representing \(B \cup C\).
Thus, the probability is given by
\(
P(B \cup C)=\frac{6}{10}=\frac{3}{5} .
\)
Three-event Venn diagram
Unless one of the three events is mutually exclusive to the other two events, we use the following convention for a three-event Venn diagram.
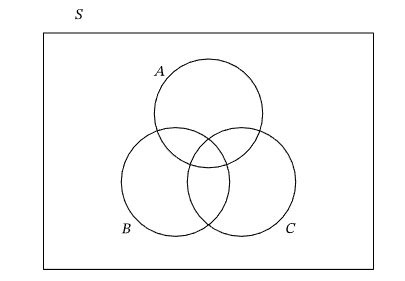
We note that all three circles overlap over the middle of the standard three-event Venn diagram. This region represents the intersection of all three events, \(A \cap B \cap C\).
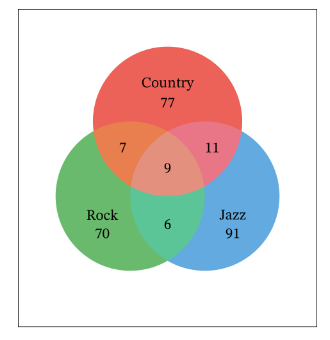
Example 7: 271 students voted for the types of music they wanted at the school dance. The results are shown in the Venn diagram. Find the probability that a randomly selected student voted for rock and not jazz.
Solution:
In this example, we are given a three-event Venn diagram. Since a student is randomly selected, we know that the probability of an event is given by dividing the number of students for the event by the total number of students, which is 271. In other words,
\(
P(\text { event })=\frac{\text { number of students belonging to the event }}{271} .
\)
So, we need to find the number of students who voted for rock but not jazz. From the given Venn diagram, the region representing this event is outlined in black:
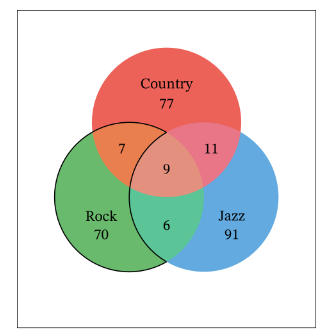
Using the Venn diagram, we can see that the number of students for this event is \(70+7=77\). Dividing this number by 271 gives the probability of this event occurring.
Hence, the probability that a randomly selected student voted for rock and not jazz is \(\frac{77}{271}\).
Example 8: In a sample of 100 students enrolling in a university, a questionnaire indicated that 45 of them studied English, 40 studied French, 35 studied German, 20 studied both English and French, 23 studied both English and German, 19 studied both French and German, and 12 studied all three languages. Using a Venn diagram, find the probability that a randomly chosen student studied only one of the three languages.
Solution:
we begin at the middle where all three circles overlap. The middle of the three-event Venn diagram represents the intersection of all three events. In our example, this represents the students who studied all three languages, of which there are 12. Next, we consider the other overlapping regions. We know that 20 students studied both English and French, but we also know that 12 of these students studied all three subjects, which means they also studied German. From this, we can deduce that 20−12=8 students studied English and French, but not German. Similarly, we can gather the following data:
- Students who studied English and German but not French: 23−12=11 students,
- Students who studied French and German but not English: 19−12=7 students.
We now add these figures in their corresponding regions. We proceed to obtain the values for the part of each circle not overlapping the other two circles. We are given that 45 students studied English, but 8+12+11 of them also studied French or German. So, the number of students who studied English but not French or German is given by 45−8−12−11=14.
Likewise, we obtain the following data:
- Students who studied French but not English or German: 40−8−12−7=13 students,
- Students who studied German but not English or French: 35−7−12−11=5 students.
In this Venn diagram, the region representing the students who studied only one of the three languages is shaded in yellow below.
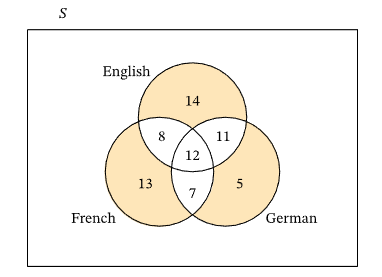
Then, the number of such students is given by
\(13+14+5=32 \text {. }\)
Since the student is randomly selected, we can obtain the probability of our event by dividing 32 by the total number of students, which is 100.
The probability that a randomly chosen student studied only one of the three languages is \(\frac{32}{100}=0.32\)