Introduction
What is a Straight Line?
A straight line is a straight one-dimensional figure that does not have a thickness, and it extends endlessly in both directions. A straight line does not have any curve in it. It can be horizontal, vertical, or slanted.
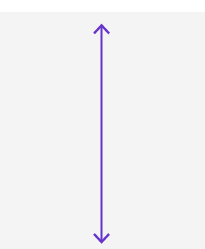
The figure below shows a straight line (horizontal). It does not have any endpoint. The two arrows at each end signify that the line extends endlessly and is unending in both directions.
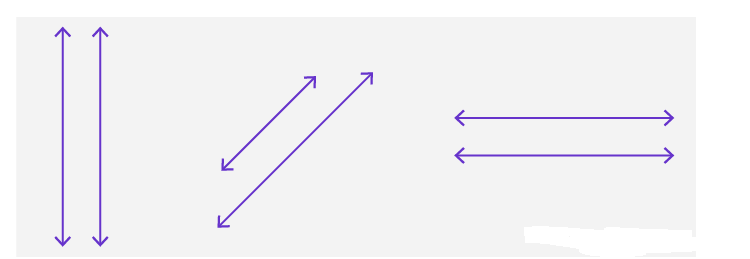
Horizontal Line: A horizontal line is a straight line that starts from either left to right or right to left.

Vertical Line: A vertical line is a straight line that starts from the top to bottom or bottom to top.
Parallel Line: A pair of two lines that are on the same plane and the distance between them is equal and remains constant. When such two lines do not intersect with each other, they are known as parallel lines.
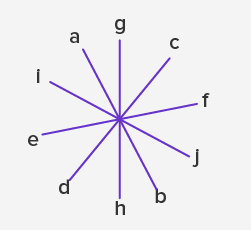
Intersecting Line: when two or more pairs of lines are on the same plane and intersect each other at one given point, they are known as intersecting lines.
Transversal Line: A transversal line is a line that passes through two or more parallel or non-parallel lines at a given point. The parallel lines and the transversal line must be on the same plane.
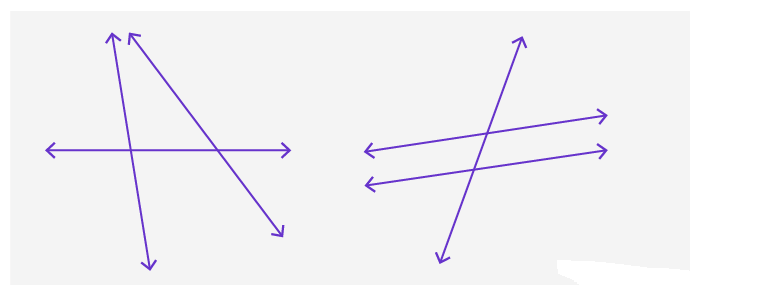
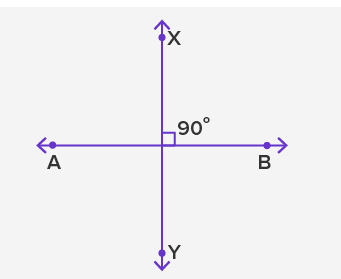
Perpendicular Line: When two lines on the same plane intersect each other and form a 90° angle at the point of intersection, they are known to be perpendicular lines.
Linear Function
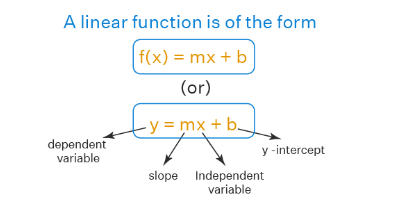
A linear function is a function that represents a straight line on the coordinate plane(x-y plane). A linear function is of the form \(f(x)=y=m x+b\) where
\(m\) is the slope of the line
\(b\) is the \(y\)-intercept of the line
\(x\) is the independent variable
\(y\) \((\) or \(f(x))\) is the dependent variable
A linear function is an algebraic function. This is because it involves only algebraic operations.
Some examples of linear functions are
- \(y=3 x-2\)
- \(f(x)=6 x\)
- \(f(x)=-3 x+2\)
Identifying a Linear Function
To identify a linear function follow the following steps
- Compute the differences in x-values.
- Compute the differences in y-values
- Check whether the ratio of the difference in y-values to the difference in x-values is always constant.
Example 1: Determine whether the following data from the following table represents a linear function.
\(\begin{array}{|l|l|}
\hline \mathbf{x} & \mathbf{y} \\
\hline 3 & 15 \\
\hline 5 & 23 \\
\hline 7 & 31 \\
\hline 11 & 47 \\
\hline 13 & 55 \\
\hline
\end{array}
\)
Solution:
We will compute the differences in \(\mathrm{x}\)-values, differences in \(\mathrm{y}\) values, and the ratio (difference in \(y\) )/(difference in \(x\) ) every time and see whether this ratio is a constant.
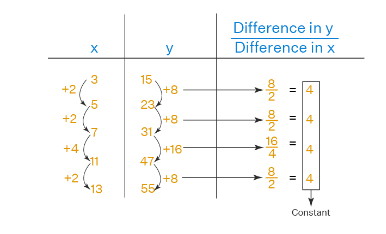
Since all numbers in the last column are equal to a constant, the data in the given table represents a linear function.
Graphing a Linear Function
- Choose a minimum of two input values (two values on the x-axis).
- Evaluate the function at each input value (find the value of y at each input selected on the x-axis).
- Use the resulting output values to identify coordinate pairs on the x-y plane.
- Draw a line through the points.
Example 2: \(\text { Graph } f(x)=-\frac{2}{3} x+5 \text { by plotting points. }\)
Solution:
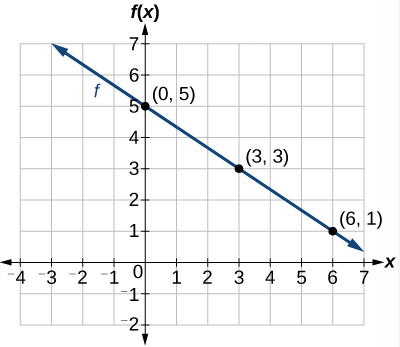
Begin by choosing input values. This function includes a fraction with a denominator of 3, so let’s choose multiples of 3 as input values. We will choose 0,3, and 6.
Evaluate the function at each input value, and use the output value to identify coordinate pairs.
\(
\begin{array}{ll}
x=0 & f(0)=-\frac{2}{3}(0)+5=5 \rightarrow(0,5) \\
x=3 & f(3)=-\frac{2}{3}(3)+5=3 \rightarrow(3,3) \\
x=6 & f(6)=-\frac{2}{3}(6)+5=1 \rightarrow(6,1)
\end{array}
\)
Plot the coordinate pairs and draw a line through the points. Figure \(2.2 .1\) represents the graph of the function \(f(x)=-\frac{2}{3} x+5\).
Deriving the Equation for a Function from the Graph of a Line
Let’s find the linear equation from the given graph below. We can see right away that the graph crosses the y-axis at the point (0,4) so this is the y-intercept
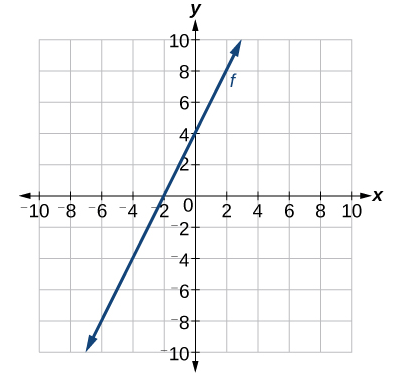
Then we can calculate the slope from the graph. We can choose any two points, but let’s look at the point \((-2,0)\). To get from this point to the \(y\)-intercept, we must move up 4 units (rise) and to the right 2 units (run). So the slope must be
\(m=\frac{\text { rise }}{\text { run }}=\frac{4}{2}=2\)
Substituting the slope and \(y\)-intercept into the slope-intercept form of a line gives
\(y=2 x+4\)