6.4 Graphical Solution of Linear Inequalities in Two Variables
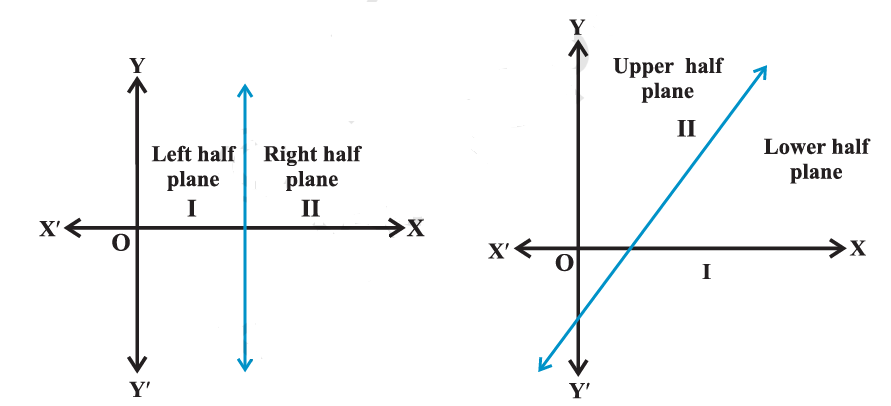
The graphical method could be the easiest to find solutions to systems of linear inequalities in two variables. Now, we will discuss the graph of a linear inequality in two variables. We know that a line divides the Cartesian plane into two parts. Each part is known as a half-plane. A vertical line will divide the plane in left and right half-planes and a non-vertical line will divide the plane into lower and upper half-planes.
A cartesian plane can be defined as a plane formed by the intersection of two coordinate axes that are perpendicular to each other. The horizontal axis is called the x-axis and the vertical one is the y-axis. These axes intersect with each other at the origin whose location is given as (0, 0). Any point on the cartesian plane is represented in the form of (x, y). Here, x is the distance of the point from the y-axis and y is the distance from the x-axis.
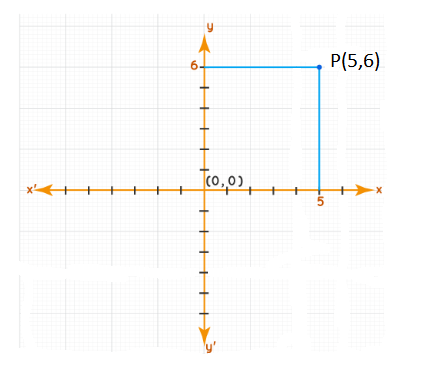
Cartesian Plane Example
The two horizontal and vertical intersecting lines are the x and y axes respectively. The coordinates of the point (5, 6) indicate that it is located at a distance of 5 units from the y-axis and 6 units from the x-axis.
Cartesian Plane Quadrants
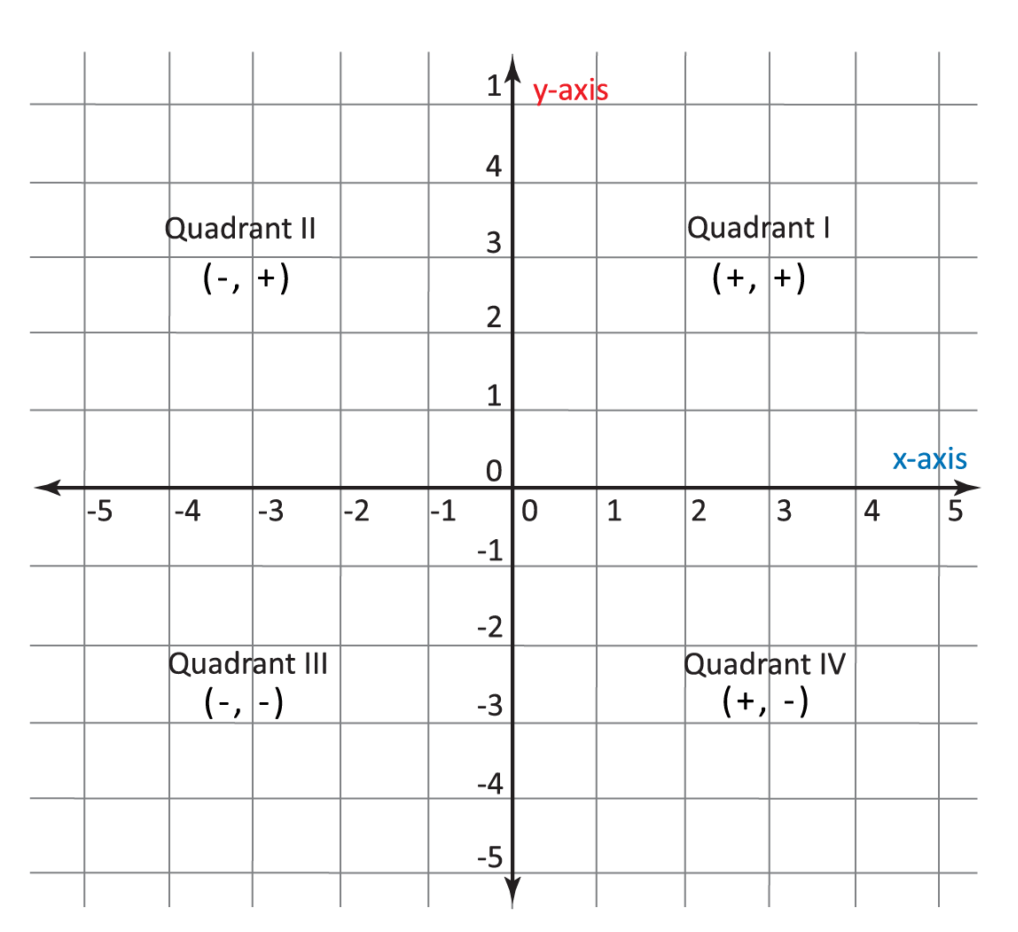
When the two axes intersect each other, it divides the cartesian plane into four infinite regions. These 4 regions are known as quadrants. The quadrants are bound by the two semi-x and y axes. The quadrants can be numbered from one to four in an anti-clockwise direction. The signs of the x and the y coordinates of a point will be different in each coordinate. Depending on the value of a point, it can be located in a particular quadrant as given below.
- First Quadrant: \(x>0\) and \(y>0\). Thus, the sign of a point will be \((+\), \(+)\)
- Second Quadrant: \(x<0\) and \(y>0\). Thus, the sign of a point will be ( \(–\), \(+)\).
- Third Quadrant: \(x<0\) and \(y<0\). Thus, the sign of a point will be \((-\), \(-)\).
- Fourth Quadrant: \(x>0\) and \(y<0\). Thus, the sign of a point will be ( \(+\), \(-)\).
The positive direction will be upwards and towards the right while the negative direction is downwards and to the left. This is shown in the figure below.
How to Draw Linear Inequalities Graph
Steps to draw the linear inequality graph is given below:
- Rearrange the given equation such that the variable ‘ \(y\) ‘ is on the left-hand side and the rest of the equation on the right-hand side. For example, \(y>x+2\)
- Plot the graph for \(y=x+2\) line by putting the values for \(x\).
- Remember to draw a solid line for \(y \leq\) or \(y \geq\) and a dashed line for \(y<\) or \(y>\).
- Now, shade the line as per inequalities, such as above the line for a “greater than” ( \(y>\) or \(y \geq)\) and below the line for a “less than” \((y<\) or \(y \leq)\)
Example 1: Solve the inequality \(2 x+y=6 \) graphically.
Solution:
Since the solution of linear equation in two variables is a pair of numbers (x,y), we can represent the solutions in a coordinate plane.
\(
2 x+y=6 \quad \dots(1)
\)
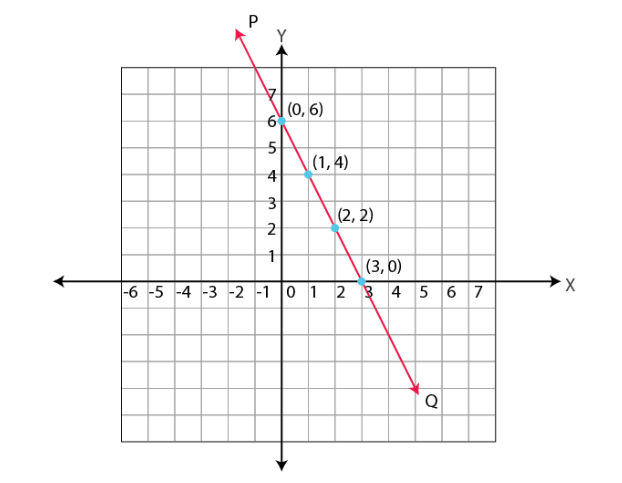
Some solutions of the above equation are, \((0,6),(3,0),(1,4),(2,2)\) because, they satisfy (1).
We can represent the solution of (1) using a table as shown below.
\(
\begin{array}{|l|l|l|l|l|l|}
\hline x & 0 & 3 & 1 & 2 & \ldots \\
\hline y & 6 & 0 & 4 & 2 & \ldots \\
\hline
\end{array}
\)
We can plot the above points \((0,6),(3,0),(1,4),(2,2)\) in a coordinate plane (Refer figure below).
We can take any two points and join those to make a line. Let the line be PQ. It is observed that all four points are lying on the same line PQ.
Example 2: Check graphically to determine if the pair of equations \(x+3 y=6\) and \(2 x-3 y=12\) is consistent. If so, solve them graphically.
Solution:
Let \(x+3 y=6–(1)\) and \(2 x-3 y=12–(2)\)
Let us get the graphs of the equations \((1)\) and \((2)\). For this, we find two solutions to each of the equations. Let’s find the value of y by substituting the value of x as shown in the table below.
\begin{aligned}
&\begin{array}{|c|c|c|}
\hline x & 0 & 6 \\
\hline y=\frac{6-x}{3} & 2 & 0 \\
\hline
\end{array}\\
&\begin{array}{|c|c|c|}
\hline x & 0 & 3 \\
\hline y=\frac{2 x-12}{3} & -4 & -2 \\
\hline
\end{array}
\end{aligned}
\)
By plotting the points \(A(0,2), B(6,0), P(0,-4)\) and \(Q(3,-2)\) on graph paper, and joining the points to form the lines \(A B\) and \(P Q\), we get
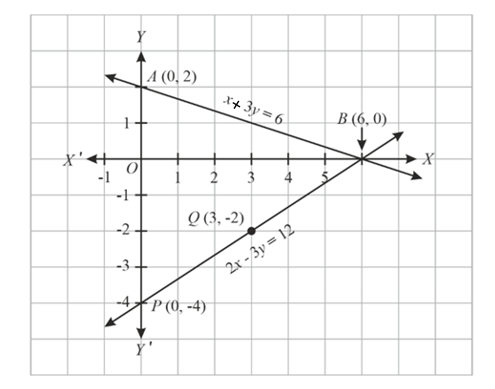
From the graph, a point \(B(6,0)\) is common to both the lines \(A B\) and \(P Q\). Thus, the solution of the couple of linear equations is \(x=6\) and \(y=0\). Therefore, the given pair of equations is consistent.
Example 3: Solve \(3 x+2 y>6\) graphically.
Solution:\(3 x+2 y>6\)
Let’s first draw the graph of
\(3 x+2 y=6 \dots(1)\)
Putting \(x=0\) in (1), we can find the value of \(y\)
\(
\begin{array}{r}
3(0)+2 y=6 \\
0+2 y=6 \\
2 y=6 \\
y=\frac{6}{2} \\
y=3
\end{array}
\)
Similarly putting Putting \(y=0\) in \((1)\), we can find value of \(x\)
\(
\begin{aligned}
& 3 x+2(0)=6 \\
& 3 x+0=6 \\
& 3 x=6 \\
& x=\frac{6}{3} \\
& x=2
\end{aligned}
\)
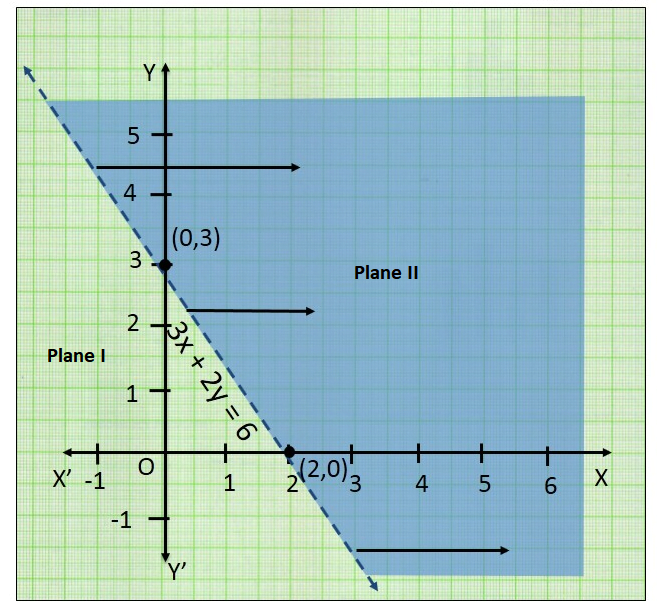
This line divides the \(x y\)-plane in two half planes I and II. We select a point (not on the line), say \((0,0)\), which lies in one of the half planes (Figure below) and determine if this point satisfies the given inequality, we note that \(3(0)+2(0)>6\) or \(0>6\), which is false.
Hence, half plane I is not the solution region of the given inequality. Clearly, any point on the line does not satisfy the given strict inequality(\(3 x+2 y>6\)). In other words, the shaded half plane II excluding the points on the line is the solution region of the inequality.
Example 4: Solve \(3 x-6 \geq 0\) graphically in two-dimensional plane.
Solution:
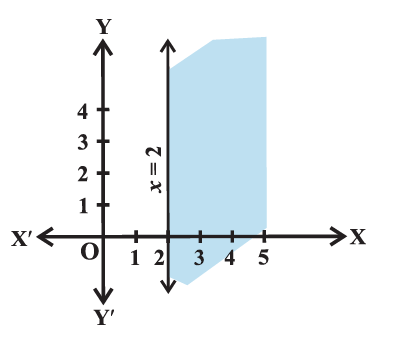
Graph of \(3 x-6=0\) is given in the figure below.
We select a point, say \((0,0)\), and substituting it in given inequality, we see that:
3 (0) \(-6 \geq 0\) or \(-6 \geq 0\) which is false.
Thus, the solution region is the shaded region on the right-hand side of the line \(x=2\).
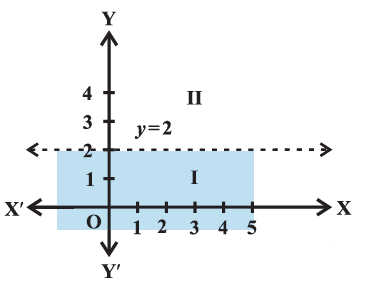
Example 5: Solve \(y<2\) graphically.
Solution:
Graph of \(y=2\) is given in the Figure below.
Let us select a point, \((0,0)\) in lower half plane I and putting \(y=0\) in the given inequality, we see that
\(1 \times 0<2\) or \(0<2\) which is true.
Thus, the solution region is the shaded region below the line \(y=2\). Hence, every point below the line (excluding all the points on the line) determines the solution of the given inequality.
